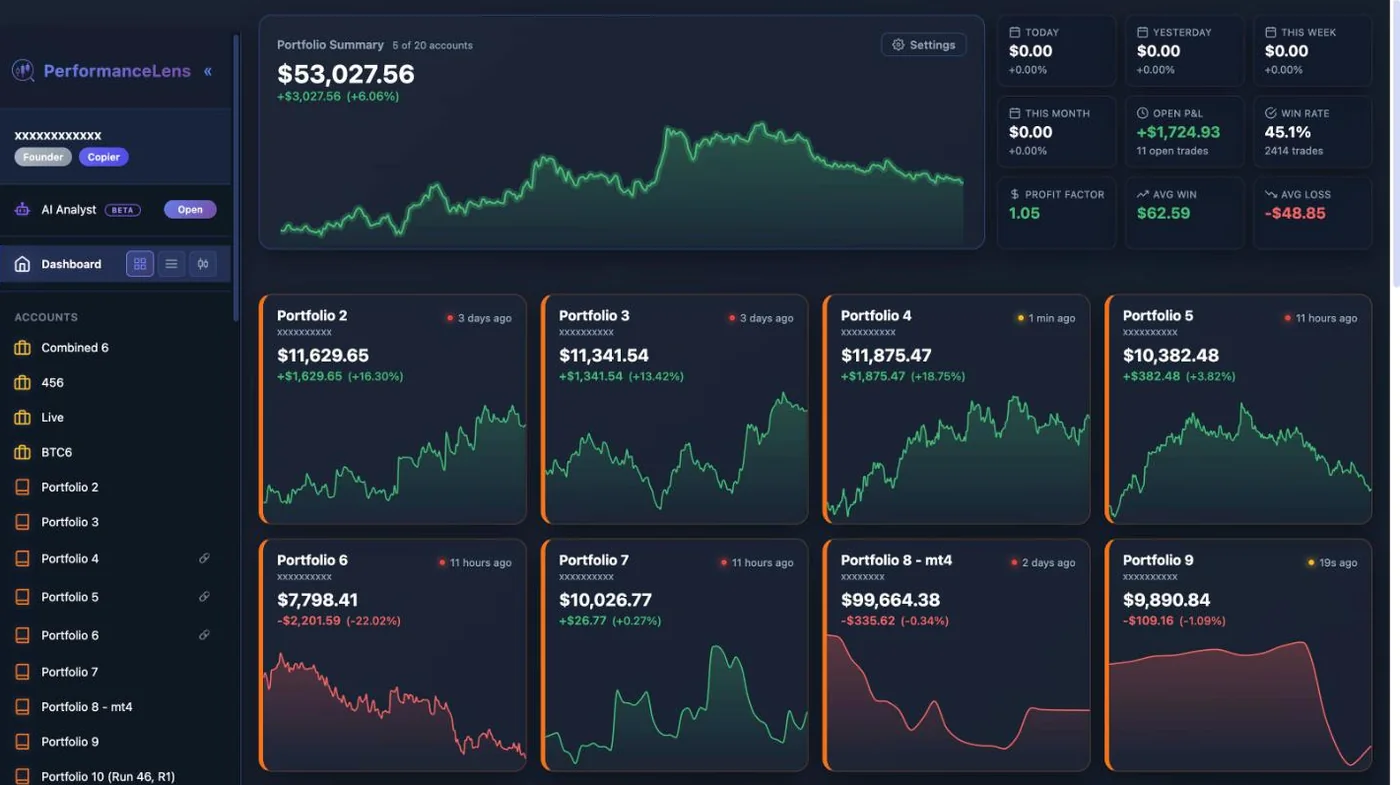
Customizable Dashboard
Connect your trading account once and every trade lands in your journal on its own — entry, exit, size and result. Syncs every 5 minutes, or every minute on the Analyst and Quant plans.
Every trade logged for you. No spreadsheets, no manual entry. From $19/month.
Excellent 4.5 on Trustpilot
Connect your trading account once and every trade lands in your journal on its own — entry, exit, size and result. Syncs every 5 minutes, or every minute on the Analyst and Quant plans.
Win rate, Sharpe, Sortino, expectancy, recovery factor, max drawdown, streaks and more — worked out for you on every account, filterable by date range and symbol.
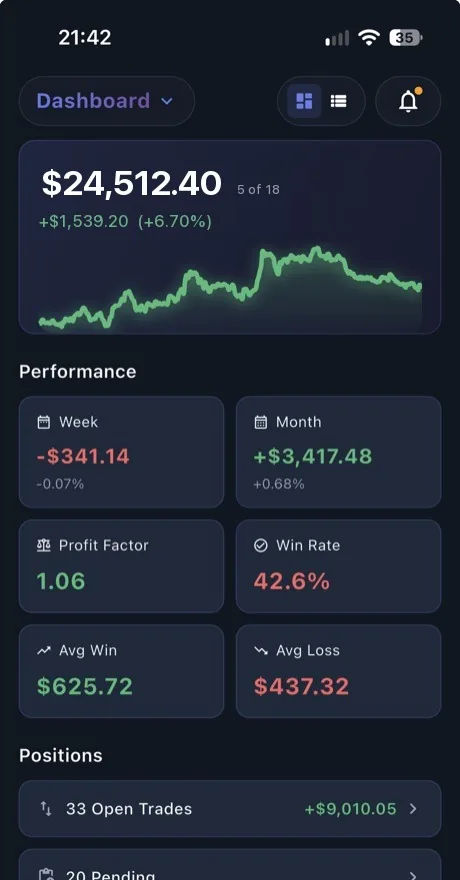
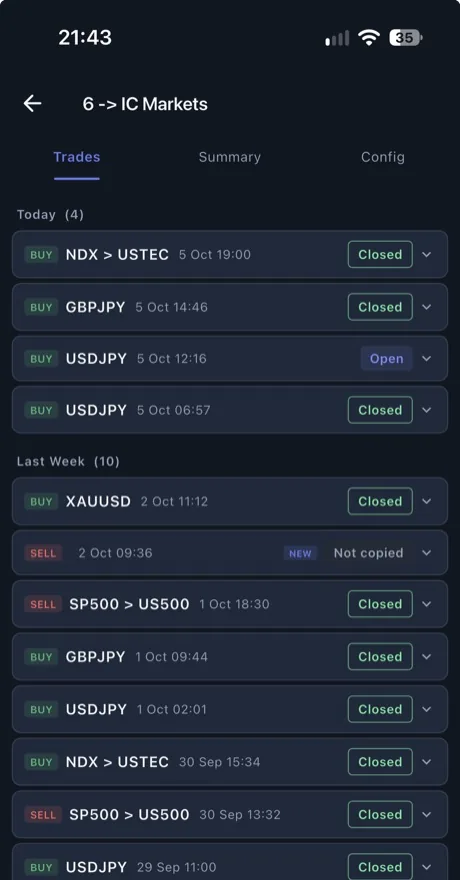
Check your journal, your statistics and your open positions from your phone, at no extra cost.

Performance Lens is fantastic multi-functional program.
Performance Lens is effectively a great productivity tool. It allows me to keep track of all of my portfolios at home or on the move. It provides in-depth detail of individual trades and portfolio statistics. The other two major…
Read more on TrustpilotFantastic Trading Tool suite - Definately give it a go!
This is an extremely useful tool for managing trading accounts. I am paying the Quant subscription and see this as worth every bit. Setting up all the performance testing and knowing this will auto update and stay very relevant…
Read more on TrustpilotExcellent Tool for your Algo needs
I dont normally write reviews. However Performance Lens definitely deserves a mention. Excellent tool for all of your Algo Trading needs. Literally everything rolled in to 1 simple to use dashboard. Including analysis, trade…
Read more on TrustpilotThe same tools you get on the full Features page, grouped by what they do. Plan badges show where a feature needs Analyst or Quant.
View all connected accounts with balance, equity, gain %, win rate and expectancy at a glance
Group accounts into virtual portfolios with aggregated metrics
Analyst QuantCustom names and color-coded account cards
Live WebSocket updates — balances, equity, and positions refresh automatically
Filter all metrics and charts by custom date range
Filter by individual trading instruments
Install the connector, paste your sync key, and data syncs automatically
Fast sync while trading, low-frequency heartbeat when idle
Compatible with every broker your trading platform supports — retail and funded accounts
AES-256 encryption before data leaves your trading terminal
Minimal log output for clean charts
Run on several trading terminals at the same time
Automatic sync of trades, positions, and account data
Higher-frequency sync for active traders
Analyst QuantWin rate, Sharpe, Sortino, expectancy, recovery factor, max drawdown, streaks and more
Account growth over time with dual balance/equity curves
Daily P/L in currency or percentage
Analyst QuantMonthly returns, drawdowns, and trade counts
Hour-by-hour analysis to find your best trading times
Analyst QuantP/L breakdown by instrument
Analyst QuantLong vs short trade performance comparison
Full paginated trade log with open/close times, prices, P/L, swap and commission
Live view of current positions with unrealized P/L
12-month return and drawdown projections based on historical data
QuantShare verified track records via encrypted public links
Analyst QuantUpload StrategyQuant X backtests and compare against live trades
QuantCorrelation matrix to identify diversification and overlap between strategies
QuantForecast portfolio performance from historical strategy behaviour
QuantMeasure how economic events affect your strategy returns
QuantCompare live portfolio metrics against StrategyQuant X backtest summaries side by side
QuantBrowse upcoming high-impact economic events with date navigation, currency filtering, and actual vs consensus comparison
Live market session tracker with Sydney, Tokyo, London and New York sessions, broker holiday schedules, and market closure calendars
Run all your strategies in one click. Set up a portfolio of EAs with their symbols, timeframes, and parameters — hit run and walk away
Schedule daily or weekly backtests via Windows Task Scheduler. Your strategies stay tested automatically without manual intervention
Results upload directly to your PerformanceLens dashboard. View equity curves, drawdown, and performance metrics alongside your live trading
Compare backtest performance against live trading results. Spot when strategies start to drift from their expected behaviour (coming soon)
Organise strategies into portfolios. Each portfolio runs independently with its own schedule and configuration
All backtest data is encrypted end-to-end before upload. Your strategy performance data stays private — even we can't read it
The same charts, metrics, and open positions from the web app — optimised for your phone
Real-time alerts for trade opens, closes, and account events — with privacy controls for what data appears in notifications
Same AES-256 end-to-end encryption as the web app — your financial data stays private on every device
Native apps for both platforms — available on the App Store and Google Play
“Which strategy is dragging my portfolio down?” Ask questions about your trading and get answers, not just charts
Answers come from your own trades, per-strategy stats and backtest results — not generic trading advice
Compares a strategy’s live results against its backtest so you can spot drift before it costs you
Bring your own API key from Anthropic (Claude), OpenAI (ChatGPT) or OpenRouter and pick the model you prefer
Runs in your browser — your decrypted data goes straight to the AI provider you choose and never passes through our servers
Save any analysis as a Word document or PDF. Included with Quant and above; AI usage is billed by your provider
A trading journal is a record of every trade you take — what you traded, when, how big, and how it turned out — so you can look back and see what is working. Most traders start one in a spreadsheet and stop updating it within weeks, because typing in every trade by hand is slow and easy to get wrong.
An automated trading journal does the logging for you. PerformanceLens reads each trade straight from your trading account and keeps your journal up to date on its own, then turns your history into the statistics and charts a spreadsheet can’t: drawdown and monthly results and, on the Analyst and Quant plans, daily and hourly breakdowns and every account combined.
It is software for reviewing your own trading. It doesn’t tell you what to trade.
Add the PerformanceLens connector to your trading terminal and enter your sync key. It takes a couple of minutes, and your past trade history comes across too.
From then on, every new trade and open position syncs to your dashboard on its own — no imports, no CSV files, no copy-paste. Your data is encrypted before it leaves your computer.
Open the dashboard or the mobile app to see your metrics, equity curve and drawdown for each account — or all of them combined, on the Analyst and Quant plans.
See each account grow over time, with balance and equity drawn together.
Your largest peak-to-trough fall in money and percent, and how far you are from your high right now.
Every day’s result on a calendar, in money or percent. On the Analyst and Quant plans.
Monthly returns, drawdowns and trade counts side by side.
Results hour by hour, to see which times of day suit you. On the Analyst and Quant plans.
Results by instrument, so you know which markets carry your account. On the Analyst and Quant plans.
Import your StrategyQuant X backtests and compare them with your live trades, to spot when a strategy starts to drift. On the Quant plan.
Share a verified track record through an encrypted public link. On the Analyst and Quant plans.
Your trade data is encrypted with AES-256 before it leaves your computer and only your browser can decrypt it — not even we can read it.



Works with MetaTrader 4, MetaTrader 5 and NinjaTrader.
Every plan starts with a 7-day free trial. Additional accounts are $4 per account, per month. Compare plans →
An automated trading journal records every trade you take without manual entry. It reads each trade from your trading account, with its entry, exit, size and result, and turns your history into statistics and charts you can review.
No. Once your account is connected, every closed trade and open position syncs on its own, every 5 minutes or every minute on the Analyst and Quant plans. You never type in a trade.
Yes. Your trade data is encrypted with AES-256 before it leaves your computer and stays encrypted in transit and at rest. Only your browser can decrypt it, so not even PerformanceLens can read it.
Yes. Trader covers 3 accounts for $19/month, Analyst 10 accounts for $39/month and Quant 15 accounts for $69/month, with extra accounts at $4 per account, per month. You can view each account on its own, or combined on the Analyst and Quant plans.
No. PerformanceLens is software for reviewing your own trading. We don't provide trade recommendations or investment advice.
Yes. The iOS and Android apps are included with every plan, so you can check your journal, statistics and open positions from your phone.
Yes. Every plan starts with a 7-day free trial. A card is required to start it, you won't be charged during the trial, and you can cancel any time before it ends.